I'm a fan of graphs and charts. In addition to telling a clear story behind vast quantities of seemingly impenetrable data (check out any one of Hans Rosling's TED talks or NYT's Interactive Dataviz) I like seeing them used in clever ways, especially when they (accurately!) express ideas which are strictly non-mathematical. The webcomic indexed is based around this concept.
Here are a few of my favorites examples of the more tongue-in-cheek kind.
"Fluctuations of three intensities over time" (lust, infatuation & attraction) has four graphs (see the others here). It's amazing how much just a few quick colored lines can convey. Do you agree with the artist? What would the graph of your current (or former) relationship/s look like?

Kurt Vonnegut is one of my favorite authors and I've only ever read one of his books. (Cat's Cradle) Note to self: read the rest of his bibliography. Here he talks about The Shape of a Story and generalizes all stories ever told into a few simple line graphs.

Video of K.V.'s short talk on the simple shapes of stories:
Dead Poet's Society has many great scenes, one of which involved graphing the formula P*I = G (perfection x Importance = Greatness). The greatness of the poem, then, is simply the area of the rectangle drawn out when one plots the perfection vs greatness on a plane. This sounds like something current metric-obsessed ed reformers would eat up with a spoon. Of course it completely strips poetry of any humanity (and this meaning) and I'll be that's something else current metric-obsessed ed reformers would eat up with a spoon, too.
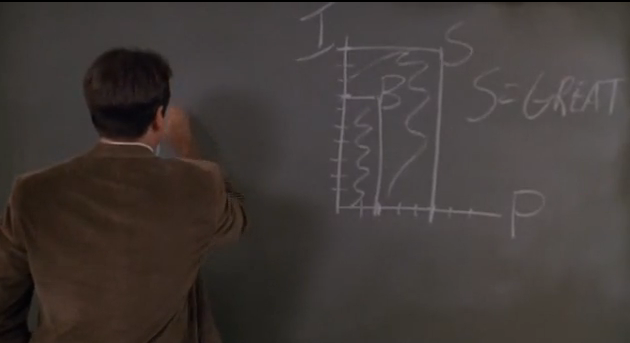
The scene where poetry is mesaured -- "Rip it out!"
Arthur Mattuck is one of my favorite MIT Lecturers. He is funny and engaging, but beyond that he makes very clever use of metaphors to help illuminate subtle and seemingly complicated ideas. Here he is using the love between George Costanza and his wife Susan from Seinfeld to model & interpret a system of linear differential equations with complex eigenvalues.
The relevant part of the lecture starts here. The full course is here.

"And we are going to consider x is modeling Susan's love for George. And George's love for Susan will be y. Now, I don't mean the absolute love. If x and y are zero, I don't mean that they don't love each other. I just mean that that is the equilibrium value of the love. Everything else is measured as departures from that. So (0, 0) represents the normal amount of love, if love is measured... I don't know what love units are. Hearts, I guess. This is a normal equation... and this is a neurotic equation."
No comments:
Post a Comment
Thank you for sharing your thoughts.